
COVES: One Year In
INTRTODUCTION
Six months ago we posted our first progress report on the virtual trading of our Country-Oriented Volatility-Enhanced Strategies (COVES). This strategy, initially presented in both SSRN paper and blog post format, seeks to provide a “double-switch” add-on to a buy-and-hold position in a country’s main equity index that bolsters performance during times of market uncertainty. The double-switch flips between a position in the index or a position in volatility depending on return momentum in both the equity index and a volatility index. In the case of the US market, COVES focuses on switching between an S&P 500 ETF proxy (SPY) and the CBOE Volatility Index (VIX), with an additional variant (Synth COVES) focused on SPY and a synthetic volatility index. Our initial works provided a robust finding, with COVES working across over 40 different countries and even showing promise in “synthetic” indexes for countries without a stock market.
Our update back in April provided a promising start, with COVES and Synth COVES both significantly outperforming the SPY benchmark with a minimal increase in standard deviation, resulting in Sharpe ratios well above 1. Furthermore, the maximum drawdown for SPY during this period was greater than for either COVES or Synth COVES, though the COVES double-switch did see a drawdown exceed -30% in that time. While the tail end of those six months started to see the introduction of global shocks to the US stock market in the form of the war in Ukraine and rising inflation, the true impact of those and other events did not occur until after this time.
In this post, we’ll be looking at how COVES has done in the subsequent six months, with an eye on the year as-a-whole. Did the increase in global stock market volatility see a confirmation in COVES’ stance as a strategy bolstered by volatility? How has a balance between the volatility-based switch and the S&P 500 improved upon an S&P 500-only strategy? Furthermore, if COVES has shown enough promising in this virtual trading arrangement, is there any way to get it into an actionable, investable form?
ONE YEAR PERFORMANCE RESULTS OF COVES
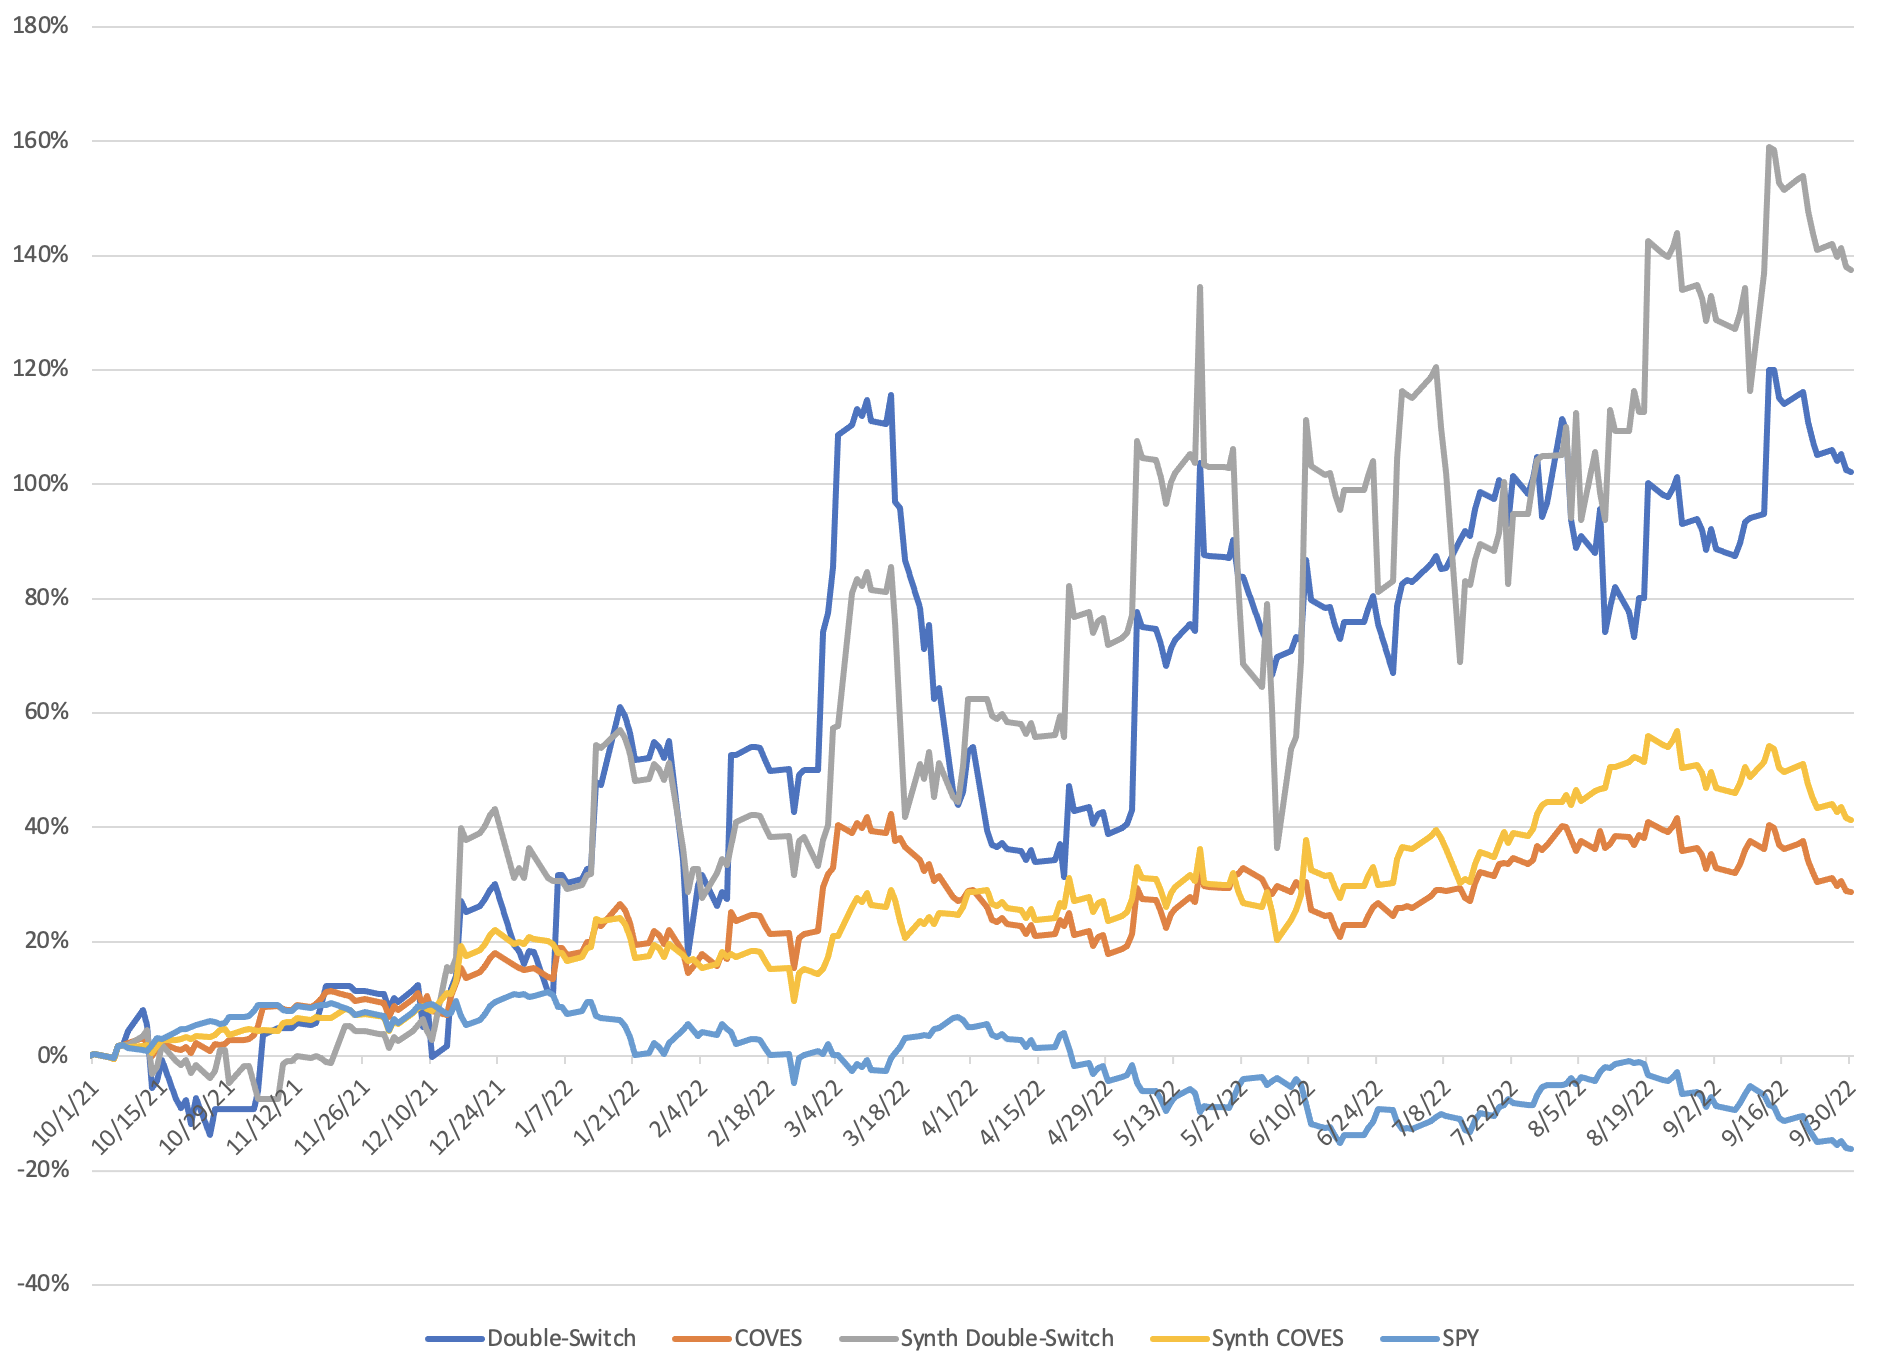
Figure 1. Total return of five labelled strategies over time from October 2021 through September 2022.
The second half of the year has presented some interesting results relative to the first half. While the two double-switches have continued their highly-oscillating climb up and to the right, the COVES and Synth COVES strategies have seen a more-modest advancement over this period. In fact, COVES was slightly down in the second half of the year, with its position at the end of September coming in slightly below its position at the end of March (28.63% vs. 28.89%). However, this slight decline looks absolutely sterling compared to the drop in the SPY benchmark, which slipped from a 5.18% return through March to a -16.22% return through September. Compared to this, COVES holding serve is a significant improvement on the benchmark and lends support to its core tenet of using volatility to reduce drawdowns in a long-term buy-and-hold investing strategy. In addition the Double-Switch, Synth Double-Switch, and Synth COVES all improved, with increases to return outpacing standard deviation for both switches leading to even better Sharpe ratios than we saw in April.

Table 1. One-Year Return, Standard Deviation, Skewness, and Sharpe ratio for five labelled strategies from October 2021 through September 2022. Risk-free rate for Sharpe ratio was calculated from the 10-year Treasury rate on 9/30/22.
In fact, we are seeing a flip-flop between the switches and COVES: the COVES variants had better Sharpe ratios than their double-switch counterparts back in April, but that trend seems to have been reversed hard in the subsequent six months. This is likely driven by the bottom falling out on SPY, since COVES is a 70:30 split between SPY and the double-switch, rebalanced quarterly. This provides a very useful insight, as the gains in SPY likely propelled COVES/Synth COVES upward in the first six months, while the double-switches have been doing the heavy lifting on keeping COVES/Synth COVES from sinking in the back half of the year. There may be some fine-tuning that can be done in this regard: for instance, perhaps altering the SPY:switch ratio each quarter based on recent trends. A move over to a 50:50 SPY:double-switch in April would’ve likely provided a much better return in the back half of the year, but it would difficult to assure that this momentum carries through an entire quarter of market performance.
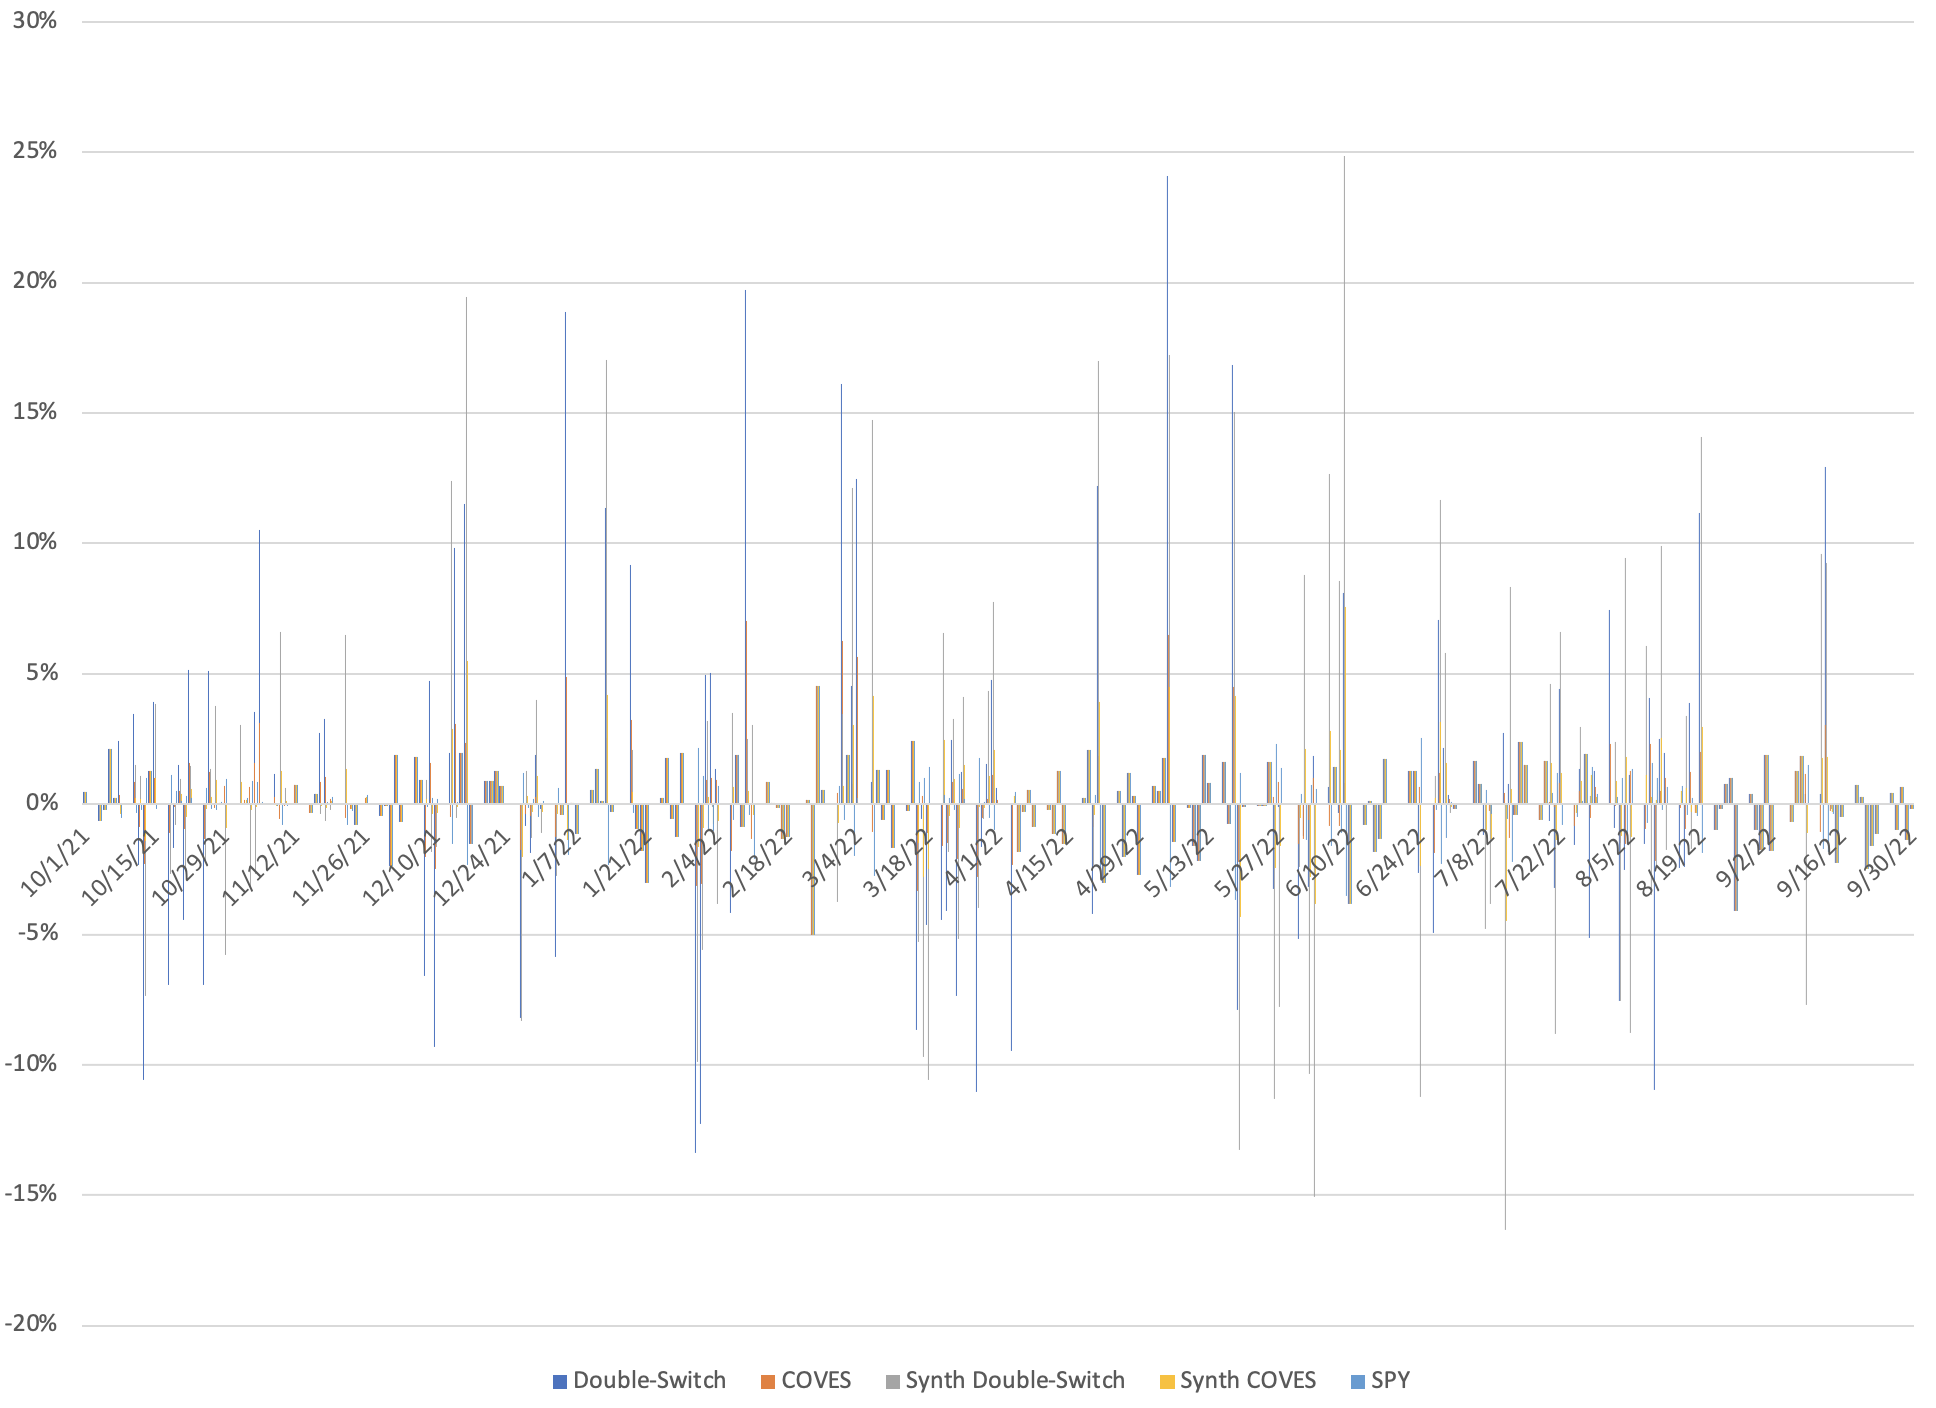
Figure 2. Daily returns for the five labelled strategies from October 2021 through September 2022.
While the amount of highly-volatile days in the market hasn’t really increased in the second half of the year, both the magnitude of the moves and their clustering seems too have altered a bit. With the exception of April, there seems to be larger and more-isolated moves in the latter half of the year, possibly indicating less of a “market surprise and mad scramble” and more of a “N steps downward, N-X steps upward” slow decline in the market. The former is much more unexpected and a huge shock to the system, causing multiple large daily movements in the market in a row as everyone tries to figure out which chair to grab after the music stops. The latter is more of an inevitable grind in one direction, with small clawbacks along the way occurring at quasi-random times. The double-switches seem to have grabbed a fair amount of these clawbacks one way or the other, but these were probably partially mitigated by lower SPY returns in the COVES strategies.

Table 2. Count of positive, negative, and no return days for the five labelled strategies from October 2021 through September 2022.
Interestingly, the second half of the year saw negative daily returns increase more than positive daily returns. Skew is down across the board with the exception of the Double-Switch, which would account for a small reversion of the two totals toward one another. Double-Switch seeing an increase in skew despite a higher percentage growth of negative returns indicates that when the Double-Switch was wrong it was at a smaller return level while returns were generally larger when the strategy was right. Contrast this with SPY, which saw more positive return days than negative, indicating that its losers on average were larger than its winners. In theory, this means that the switches and/or COVES don’t even need to have positive days outnumber negative ones, as long as the days when it is right are the ones that have big favorable moves in the market.
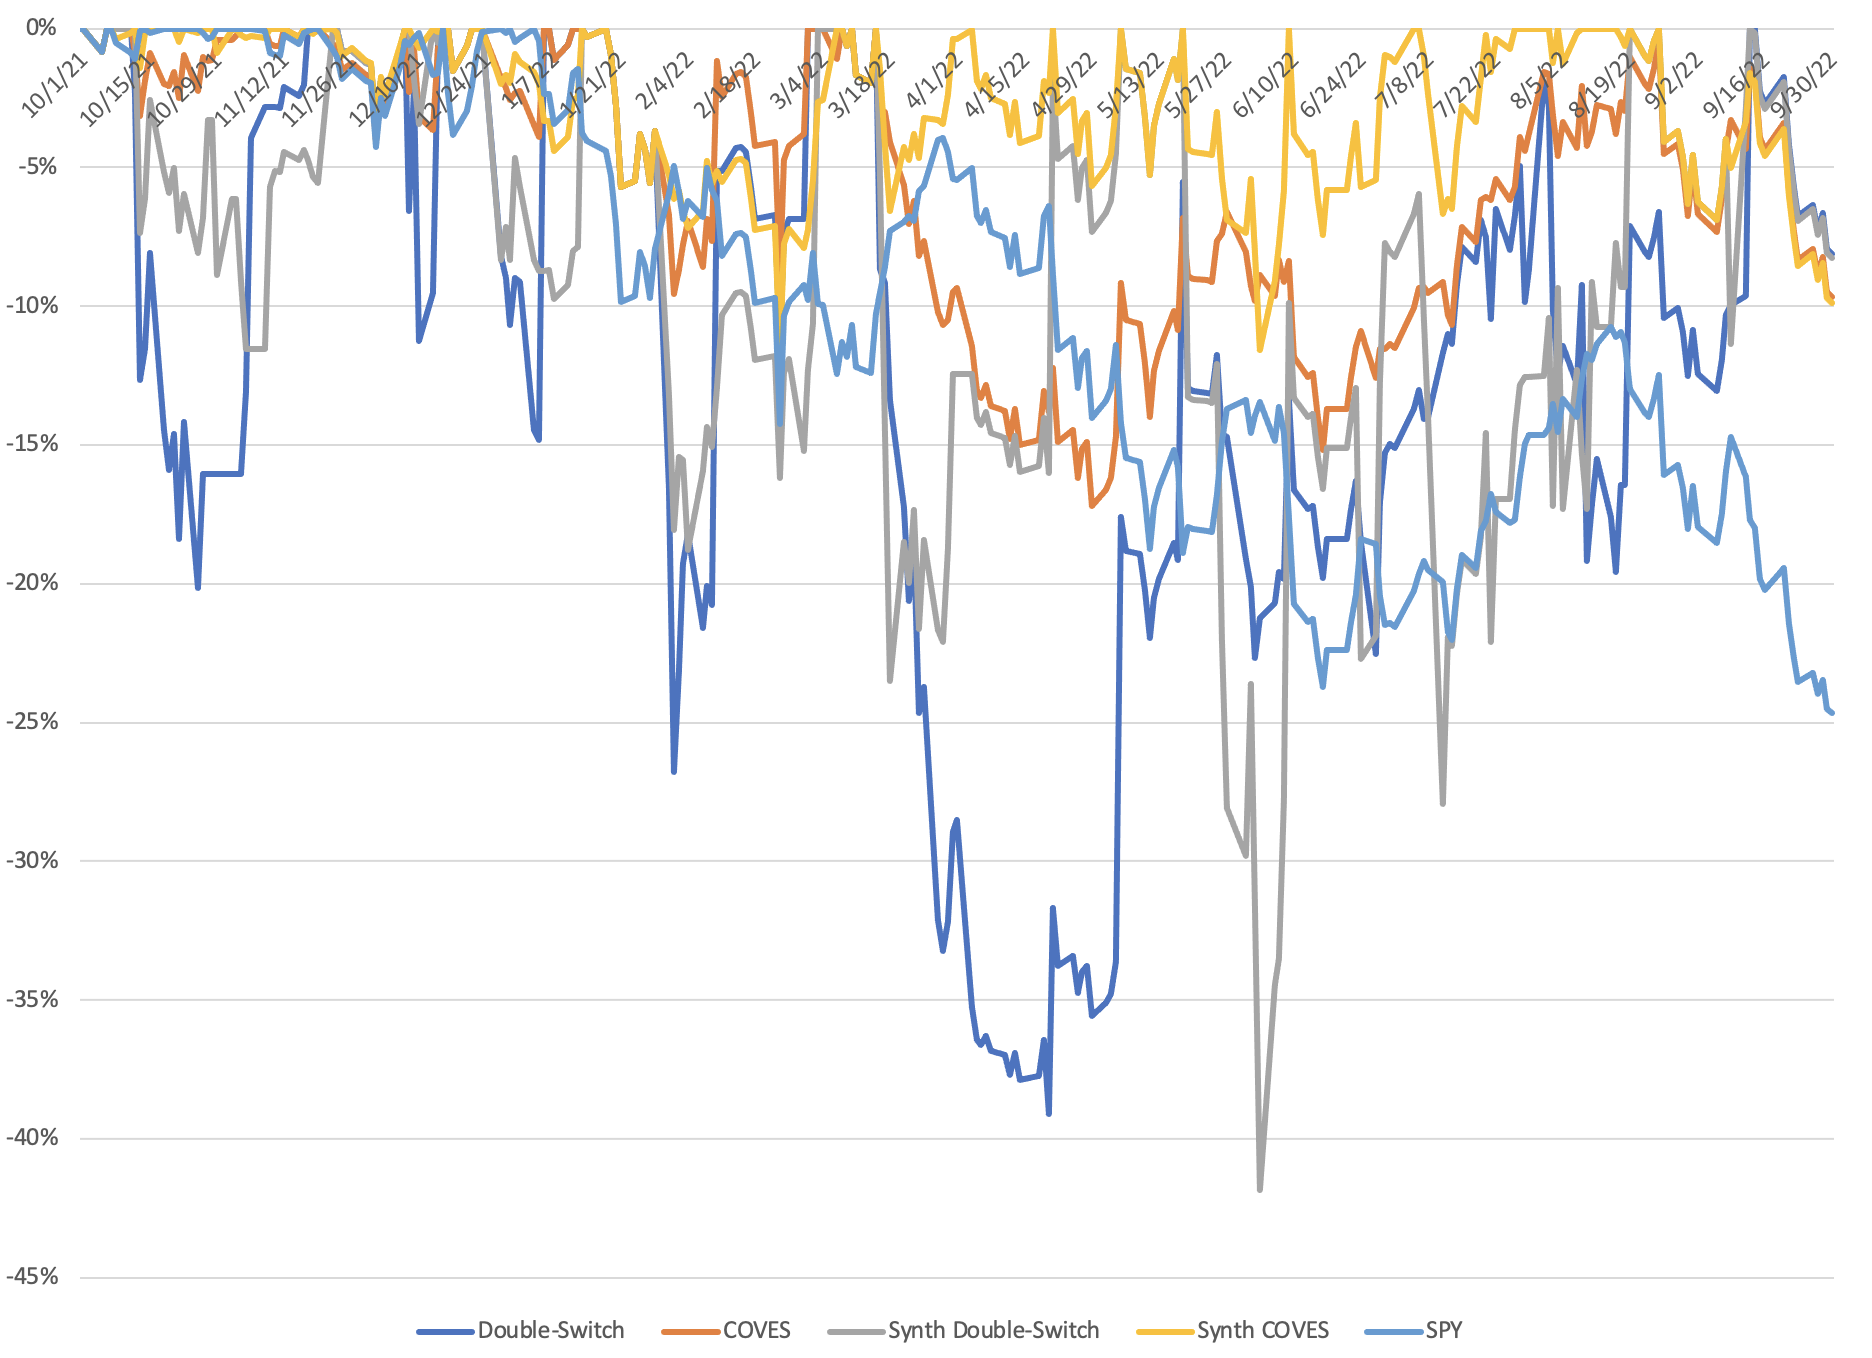
Figure 3. Drawdowns for the five labelled strategies starting in October 2021 through September 2022.
Figure 3 might be my favorite chart on here, as it provides the rosiest reflection of COVES performance over the back half of the year. While COVES was flat over the past six months and didn’t see any metrics that were too promising in the topline numbers, the drawdown chart really throws into perspective how well the strategy performed from April to September. In the first six months of the test, COVES, Synth COVES, and SPY were are jostling back and forth in terms of drawdown placements, with Synth COVES typically winning out in that race. Starting in mid-February, Synth COVES has not seen a day with a drawdown exceeding that of SPY. COVES was mixing it up more often with SPY, but since mid-May it too has not dipped below SPY’s level in terms of drawdowns. Even the wildly oscillating double-switches have managed to stay above SPY since the beginning of September. This is the core concept behind the idea of COVES: not necessarily to outpace SPY in good times, but to absolutely put on the brakes when the market heads into a downturn or period of uncertainty. While the back half of the year wasn’t the best in terms of absolute return, COVES continued to improve in terms of relative return. Standing still when everything else is moving backward is pretty much the same as moving forward in terms of relative strength.
MAKING COVES INVESTABLE
With COVES and the double-switches continuing to show their value and worth a year in, we once again circle back around to the big question: how can we actually invest in COVES? Six months ago, I was making the argument for a DeFi solution, one that could use the power of a trustless oracle-based token to create a synthetic investable VIX to allow us to hold a tangible position in market volatility. Well, there is a nuclear winter that DeFi is currently mired in due to scandals, robberies, and the like, and it seems that the projects with actual solid teams and foundations have gone to ground to weather this out and continue to make progress until they and the world are ready (a progression that eerily mimics the Dot-Com Bubble, crash, and slow climb that companies like Amazon and Microsoft weathered). This pretty much rules out a DeFi synthetic token for the time being.
So, what about VIX proxies currently in the market? Surely a VIX-based ETN would provide a reasonable enough facsimile of the VIX to allow for some permutation of COVES to thrive? I took a look at four potential options along this line of thinking using two VIX-based ETNs: double-switches using VXX and UVXY, both with the ETN signaling when to switch, and with VIX providing the signal.

Table 3. One-Year Return, Standard Deviation, Skewness, and Sharpe ratio as well as a count of positive, negative, and no return days for four VIX ETN-based strategies from October 2021 through September 2022. Risk-free rate for Sharpe ratio was calculated from the 10-year Treasury rate on 9/30/22.
Unfortunately, this does not seem to be a viable option. The VXX Double Switch is the best of the bunch, with a 36.90% return but a skew of 0 and a Sharpe ratio of only 0.52. While the others all outperformed SPY over the year, their performance greatly lags behind the VIX and Synth Vol switches. Why is this so different? Well, VIX-based ETNs and other products suffer from pretty much always being in contango, or that the futures price is higher than the spot price. VIX is pretty much always expected to rise, so that expectation is priced in. More expected rise? More distance between futures and spot prices. Essentially, it’s a bit of a Xeno’s Paradox: the more you expect volatility to rise the more expensive the market prices the futures. You pretty much have to catch VIX napping in order to take advantage of these ETNs, something that is very unlikely to happen except in strong bull markets. VXX and UVXY and other VIX-based products are really only useful in certain situations and can’t be relied upon for strategies such as this. The hunt for a COVES proxy continues.
Still, the first year of COVES has been a promising one so far. COVES and Synth COVES have greatly outpaced the market as represented by SPY and have shown a clear and unmistakable adherence to its core tenet of providing a volatility-hedged position in a buy-and-hold index investment strategy. The dream of being able to have an investment portfolio that is truly anti-fragile to a market downturn has its blueprint. Now, the next step is to find a way to actually build the damn thing.